Case study · Tracking California
A decade of data, finally readable at a glance.
Tracking California holds ten years of environmental and health data for every county in the state. A GIS researcher needed deep queries; a resident just wanted to check their own backyard. One interface had to do both, in English and Spanish.
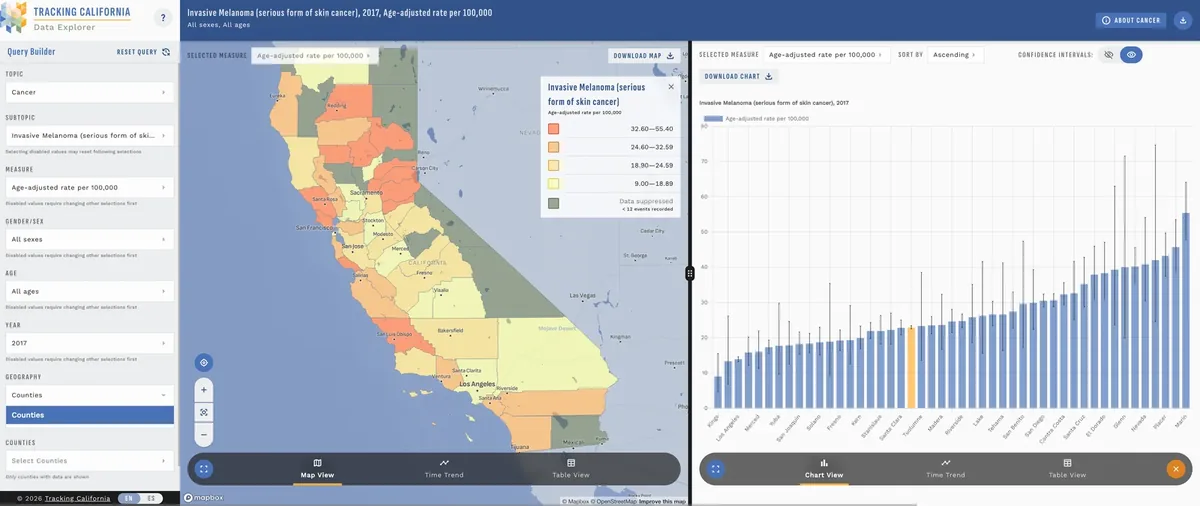
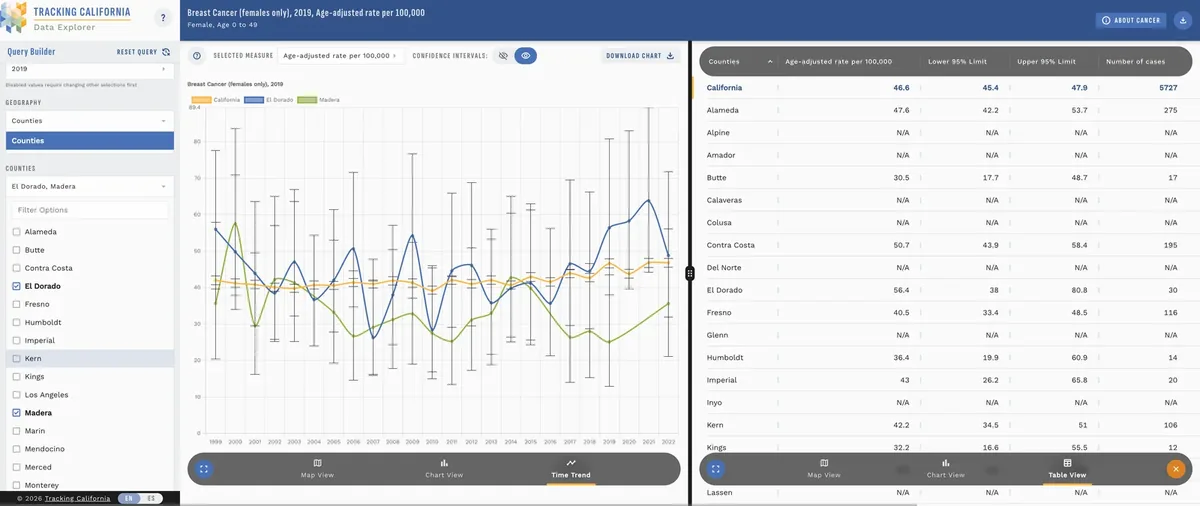
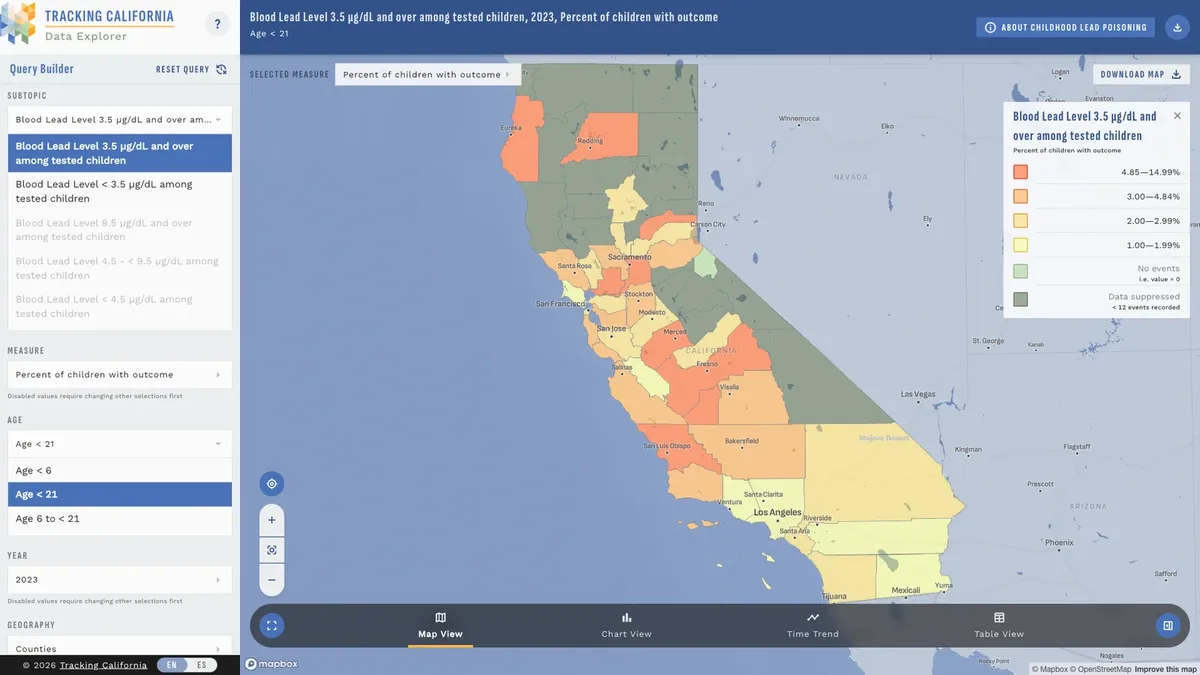
I designed and built it straight into Preact, so the interface was reacting to real data from day one instead of a mockup's best guess. The query builder unlocks one step at a time, topic, then subtopic, then measure, then geography, so nobody's facing 200 choices at once.
Accessibility went into the components themselves, not a pass at the end. Every piece the engineering team reached for was already WCAG-compliant, so nobody had to remember to make it so.
It's live today, public, and serving two very different kinds of user without ever feeling like two different products.
See it live →What are we making?
or email hello@schwaduct.com